Overview
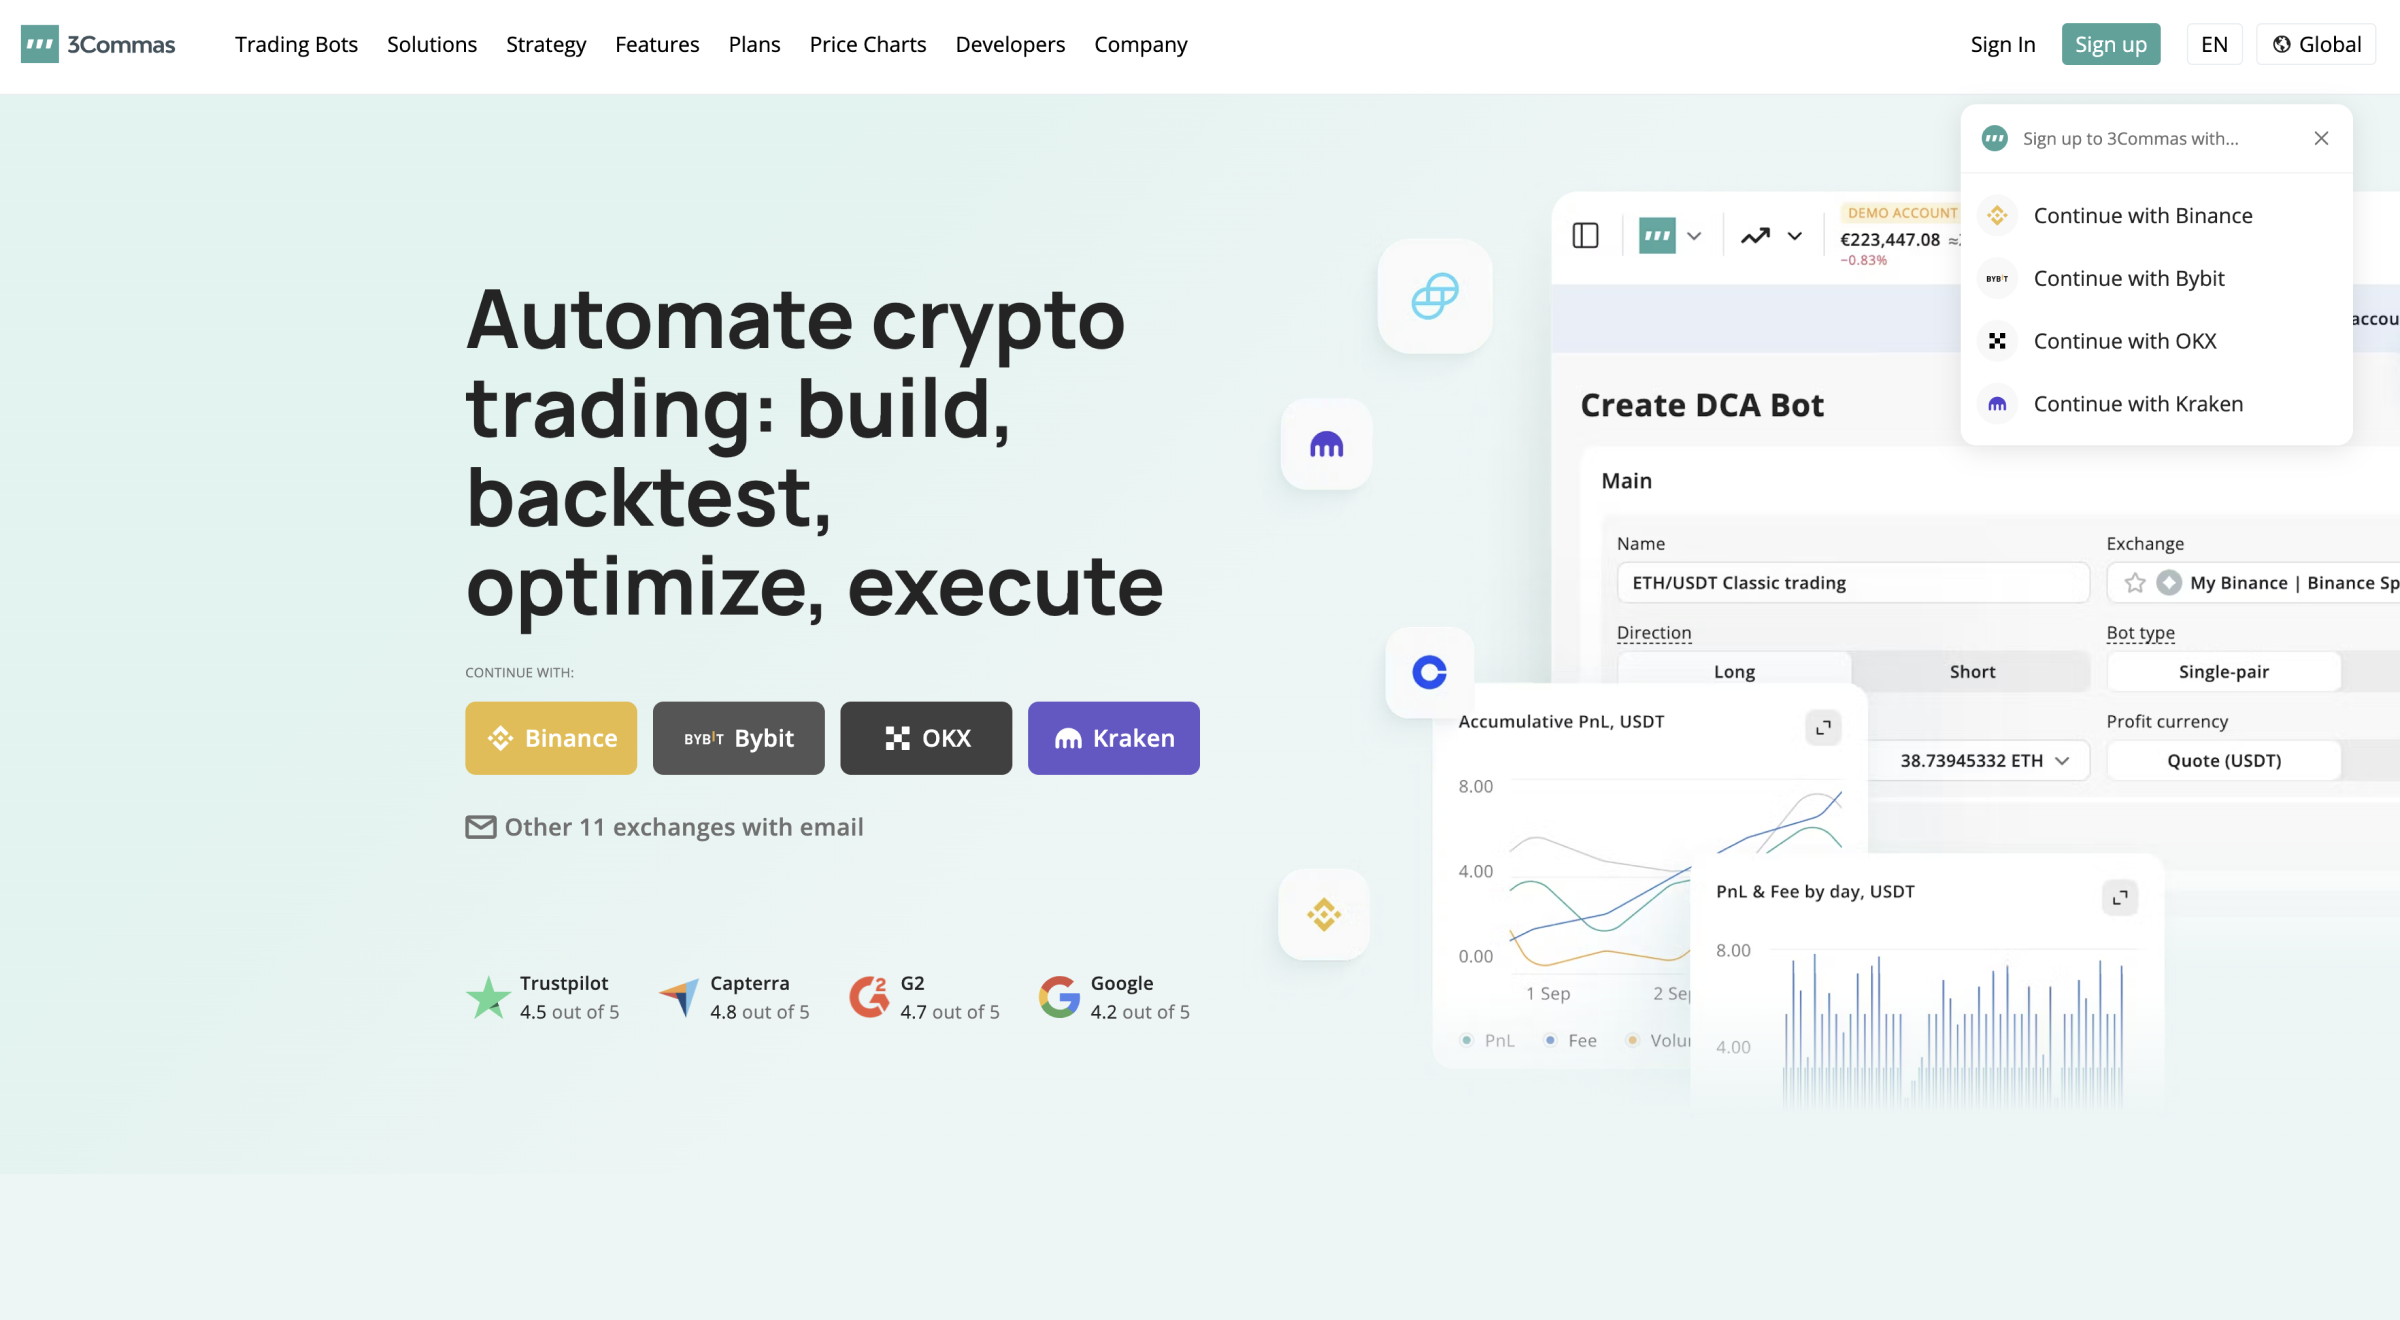
3Commas already had GRID bots, DCA, and a strategy marketplace. The infrastructure was mature. Setup was not.
Traders could not see orders, averaging logic, or take-profit levels before they launched a bot. The goal was to make the interface explain the mechanics : not hide them behind forms.
Challenge
After tapping Start, the product stopped explaining itself. People could not trace where trades opened, why positions averaged, or where profit was taken.
GRID read as a parameter table. DCA read as a form. Setup completion held at ~52%. Experienced users stayed; new users dropped off.
GRID
GRID Bot places buy and sell orders between two price levels and trades inside that range. The logic was clear to engineers. On screen, it was only numbers.
We mapped each order to the chart. Moving a level updated the grid, range, and projected profit. Simulation showed how the bot would behave as price moved : before anything went live.
Setup follows three steps:
Configure. Range, order count, and strategy type : edited on the chart, not in a side panel.
Simulate. Parameters update the grid in real time. Entry and exit points preview on the chart.
Monitor. After launch, each trade, active order, and range shift stays visible on one dashboard.
Conservative, Balanced, and Aggressive templates cover beginners. Advanced users can expand any template manually.
GRID became a visual setup flow : not a spreadsheet with a Start button.
DCA
DCA uses the same pattern: an averaging curve on the chart shows where the bot adds positions and why. DCA Bot behavior is visible before launch.
Process
Interviews focused on one question: when do you lose confidence? Answers pointed to the moment after Start : when the product went silent.
We prototyped in Figma, tested each step, and removed anything that did not help someone decide to launch. Labels were simplified; advanced options stayed collapsed.
Ship criteria: the user can describe what will happen when they tap Start.
Outcome
After GRID and DCA shipped, setup completion and time on task moved together.
| Metric | Before | After | Change |
|---|---|---|---|
| Completed bot setups | ~52% | 87% | +35 pts |
| Average setup time | 4m 20s | 2m 35s | -40% |
| Trading volume (GRID + DCA) | - | +13.2% | after launch |
| Active bots | - | x2 | active bot users |
| Understand what my bot does | 38% | 72% | +34 pts |
Impact
Users ran multiple grids, tried strategies in the marketplace, and returned to adjust parameters : behavior that had been rare when setup felt opaque.
Support questions shifted from how does this work to how do I optimize this : a sign the UI was doing the explaining.
Automation only scales when people trust what they launch. Visualization turned GRID and DCA from black boxes into inspectable tools.
Key terms
GRID Bot : Places buy and sell orders at set price levels inside a range. Profits from price moving up and down within that range.
DCA Bot : Invests a fixed amount on a schedule. Spreads entries over time to reduce the effect of short-term price swings.